History of Connections Screener in RI
| Site: | BRIDGE-RI |
| Course: | Implementing an SEL Screener at the Secondary Level: Measuring Connections (Coming Fall 2024) |
| Book: | History of Connections Screener in RI |
| Printed by: | Guest user |
| Date: | Friday, April 25, 2025, 11:58 PM |
1. Setting the Stage
This book will help course participants better understand how the Connections Screener and the processes of implementation have been used in the past several years in RI. After you have completed this book, you will be asked to answer several questions about what you just learned.
1.1. How the Connections Survey began
Connections Screener Timeline
|
|
|
|---|---|---|
|
|
|
|
|
|
|
|
|
| ||
|  |
1.2. Current Implemation
Kim to do a screencast - don't half-ass it! Why it's not happening in BHS now
1.3. School involvement
In 2012 the Connections Project began working with cohorts of schools across an entire school year to help them with all processes involved in implementing the Connections Screener. We worked with 3-5 schools each year and supported them by:
- providing them with all connections screener materials and resources to better understand the importance of connectedness;
- explicitly describing ways to build buy-in;
- providing examples of successful implementation practices;
- providing data tools and support to collect and analyze connections data;
- sharing ideas for next steps once the data was analyzed; and,
- holding on-line meetings throughout a school year to provide guidance through each step of the connections screening process.
While working with multiple schools across several years, we learned some critical lessons.
What we've found: |
Successful schools: |
Lessons Learned: |
|
|
|
|---|
You will learn more about evidence-based implementation practices further in this section of the course.
2. About the Connections Screener
The Connections Screener, as a tool, is actually quite simple. We've found that its simplicity can, unfortunately lead people to think the the screening process is easy. We'll be clear:
Simple Tool |
Easy Process |
|---|
The Connections screener has two components:
- A survey given to students
- A survey completed by staff
These may be found in the Connections Screener manual, which will be looked at in more detail in another activity. Although your screening process may look slightly different because of the COVID context or the group of students select for piloting your Connections Screener, you will want to refer to this manual and the resources within in, such as:
- Example scripts: These may be used as a guide for conversations with students to prepare them for the survey.
- Paper-and-pencil forms: These may be used as examples for creating your Google forms.
- Follow-up forms: These are used as a guide for follow-up conversations with students who chose not to participate in the survey or who do not indicate any connections at your school.
There are also some additional resources (found in later sections of this course):
- Connections Readiness Checklist: This outlines essential features that we've found need to be in place for a successful screening process. You will be asked to take a deeper look at this in the next section.
- Steps for obtaining buy-in: This describes different ways you can communicate with staff to increase their awareness of the importance of connections and to increase interest and willingness to complete the staff survey and explain the student survey to their students in a meaningful way.
2.1. Connections Screener implementation and follow up processes
Below are important considerations for planning screening.
- Before administering the screener (on a different day), identify how staff will lead discussions with students about "What is a Connection." This pre-activity prompts students to start thinking about adults in the building they have a connection with.
This is a critical step that is essential to the process. During the first synchronous meeting on November 5th, we will provide a video example of a teacher leading this discussion with his advisory group.
- Make sure you have the student screener established in Google Forms. We will talk about this in more detail later in the course.
- Students should take the Connections Screener while at school and during a supervised time to ensure each student participates. In the past this most frequently occurred during an advisory period. Proactively brainstorm any administration barriers
that may occur and develop a plan to include: ensuring all students have access to an electronic device and access to the survey link, whether all grade levels will complete it on the same day, what do we do if there are wifi/connectivity issues,
etc.
- Plan for follow up administration for all students who were absent of the day the screener was administered or who did not complete the screener. Hint - this will take longer than you anticipate! This means you need a plan to account for
who has and has not taken the screener.
- After you have allowed for enough time for administration of the survey and follow-up for absentees, establish a staff member to initially review the screener results to ensure they are in a format for your school team (this may be your building based
MTSS or data team, problem solving team, etc.) to easily analyze. You will also need to "clean and code the data." This will be discussed in more detail in a future section. Later in this book, we will show what the data spreadsheet looks like
after this process has occurred.
- Schedule your school team to review and analyze the data.
- Follow up contact and interventions with students that data shows are lacking connections.
Below is a flowchart that describes a typical administration of the Connections Screener process; however, in this course, you will be learning the basics of how to establish a screening process by either piloting a small-scale version of the screener with fewer students and educators OR planning for a pilot in the following school year. This flowchart is to demonstrate typical administration once the process is scaled up in your school.
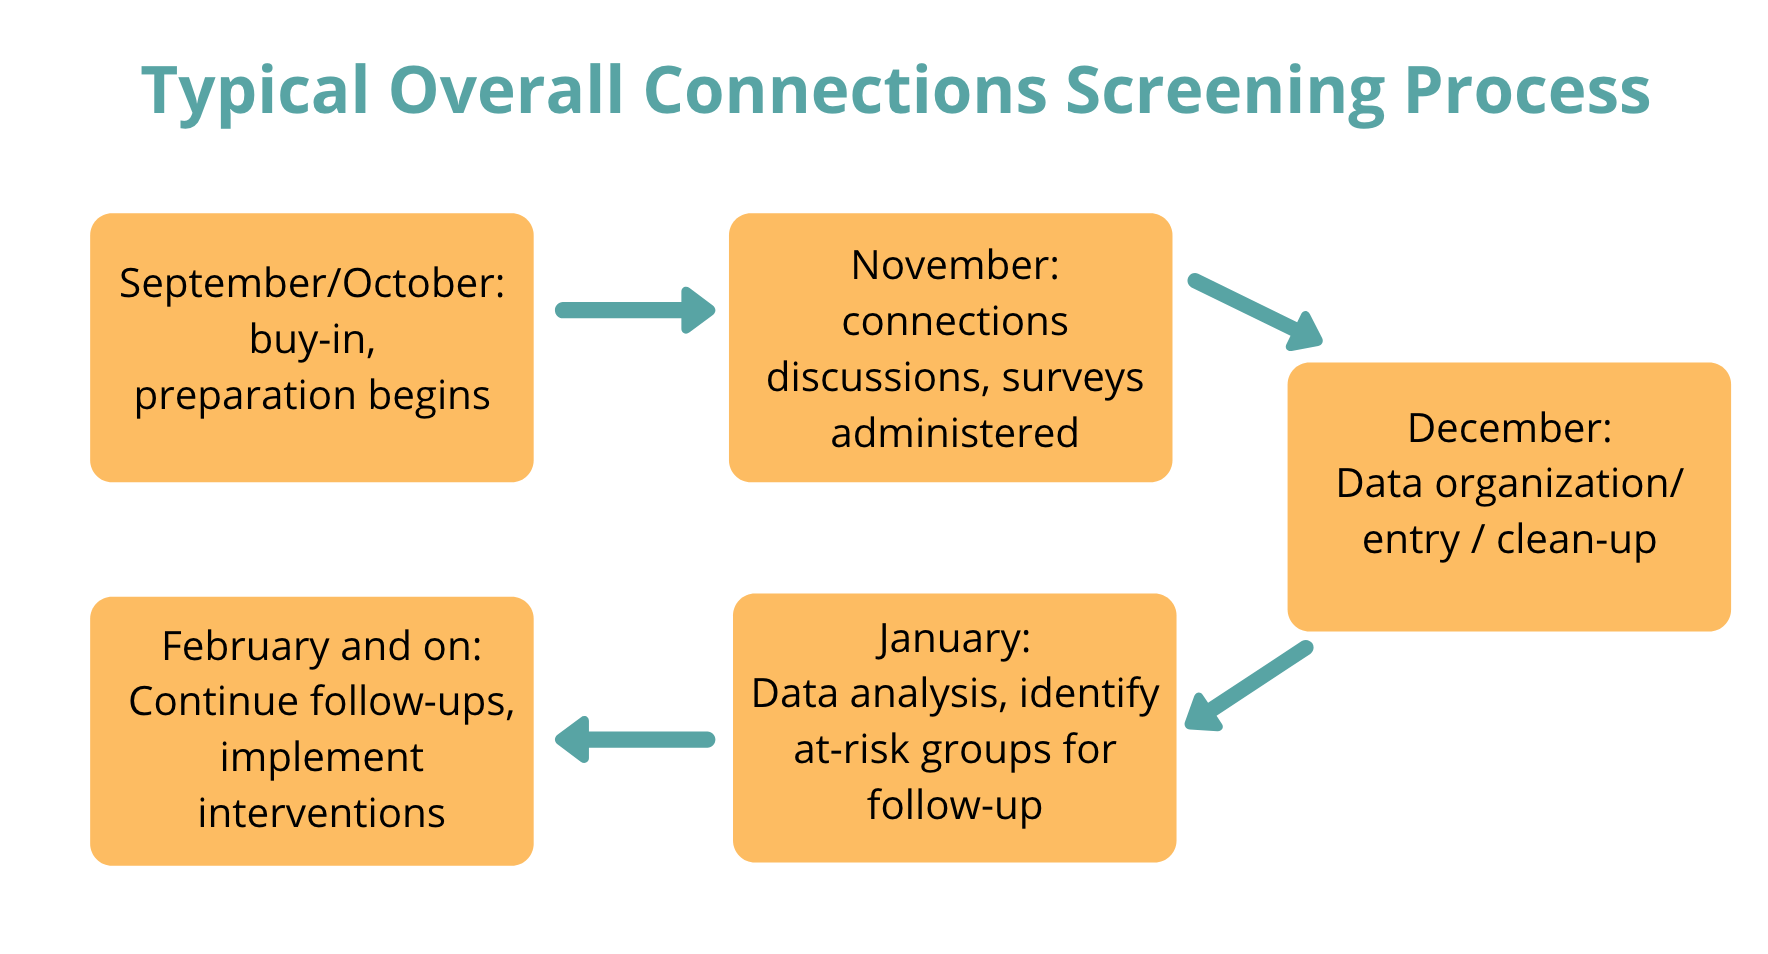
Select the typical overall connections screening process for a screen reader version of this image.
*Schools who participated in past Connections Screener Project cohorts were provided with a copy of a master form which they saved, renamed and edited for their own schools.
2.2. Connections data
In this section, there are two different ways we want to talk about data. First is how the data is prepared for analyzing. Watch this screencast as Kim walks you through how the data sheet is prepared.
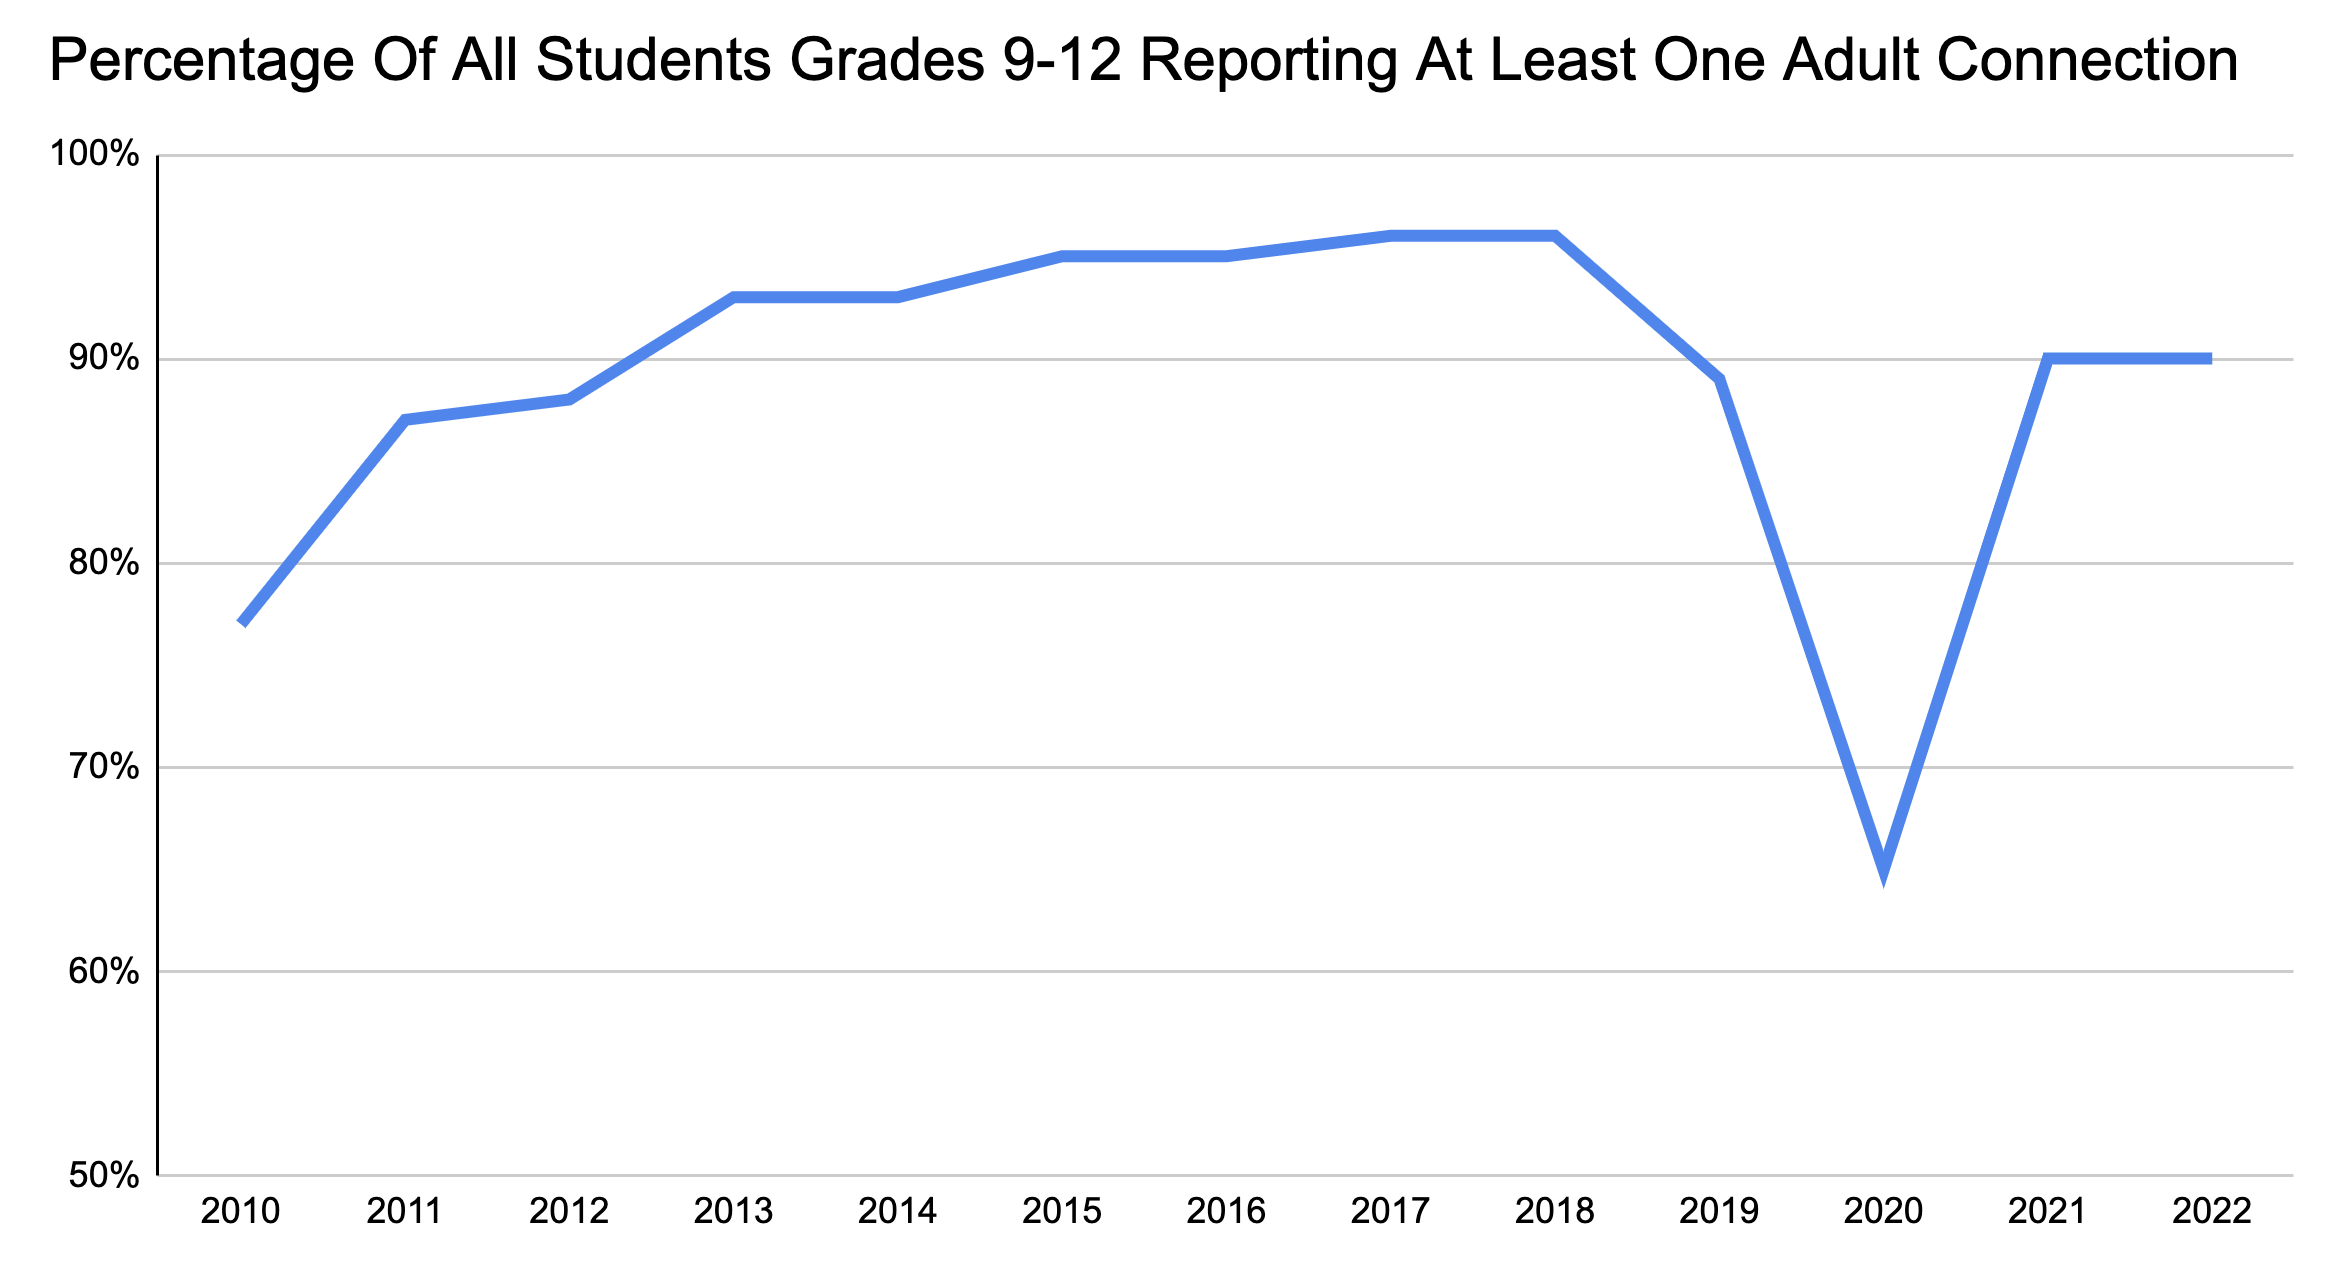
An important element in using data from your screener is to present it to staff and to measure connectedness from year to year. Here are examples of how data has been used over time in Burrillville High School (BHS).
In this graph, the percentage of all students in grades 9-12 reporting at lease one adult connection at BHS from 2010-2022 are shown. In the first year of implementing the screener in 2010, roughly 77% of all students in grades 9-12 reported at least one adult connection. Over the next eight years, the number of students reporting at least one adult connection steadily increased to around 97%. In 2019, the number of connections decreased to 89% and then during the COVID in 2020, that number decreased notably to around 65% of students indicating at least one adult connection. In 2021 and 2022, the number increased to 90% for both years. By tracking the data from year to year, it's easy to see trends over time. If staff had discontinued administering the survey after the first couple of years, and responding to the data once it was collected, do you think the data would have continued to trend upwards? What about after the pandemic?
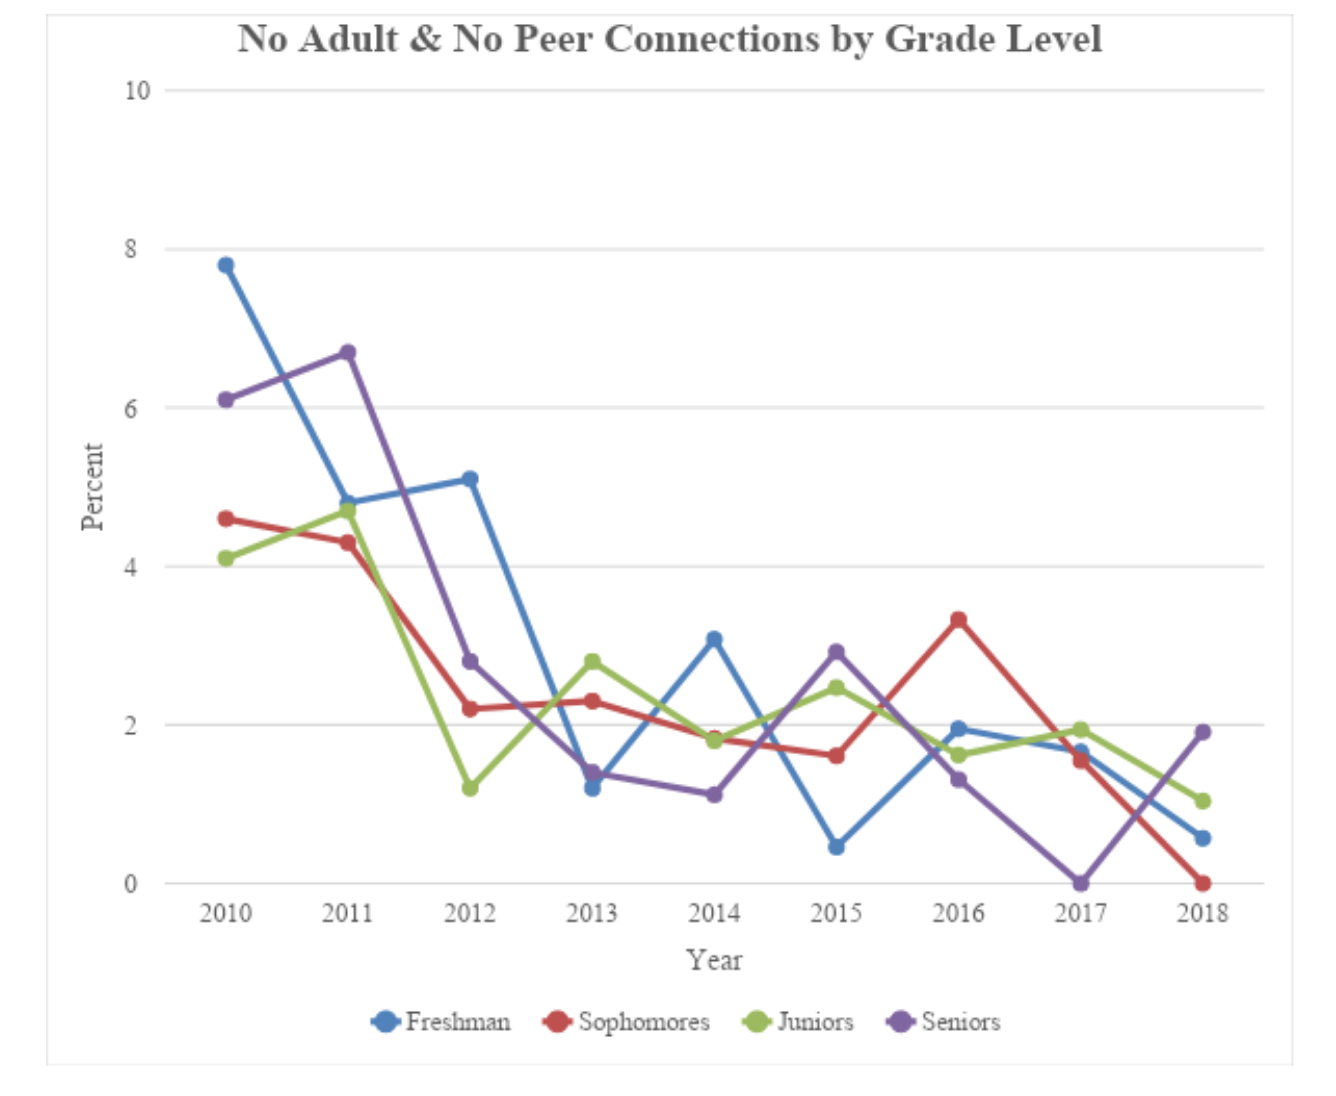
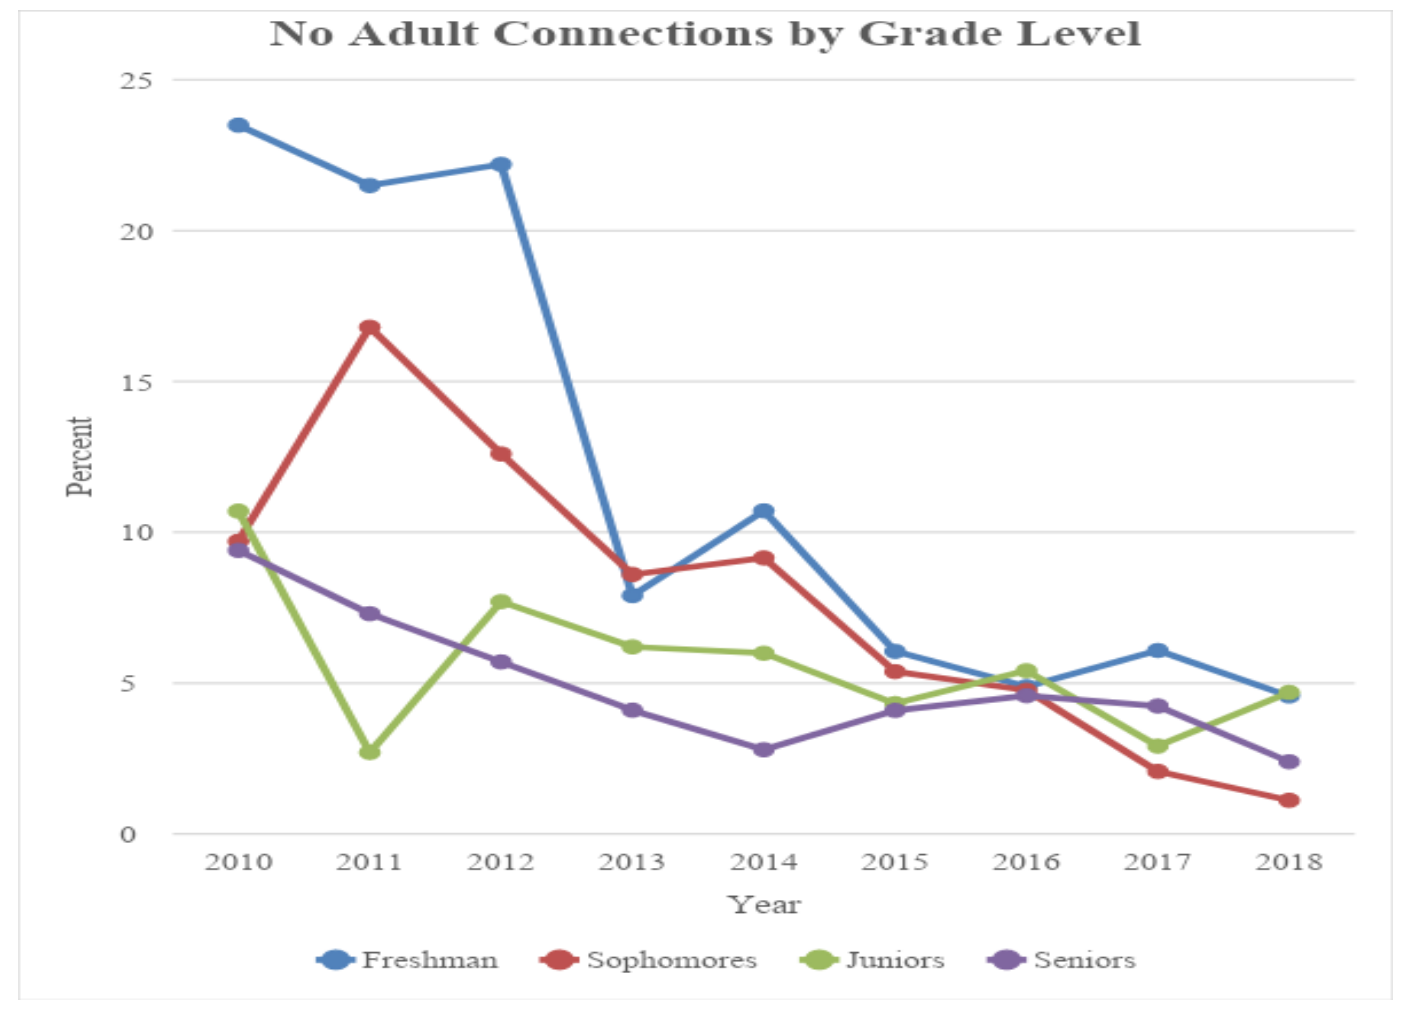
In our past Connections Project cohorts, we had the benefit of partnering with school psychology graduate students from the University of Rhode Island in order to run statistical analysis on data from our cohorts. Select below to see the data collected during that partnership.
2.3. Use of results (connecting with students)
Data is only useful if you do something with it. When analyzing, determine which students are most at-risk. Traditionally, the Connections Screener has used the following:
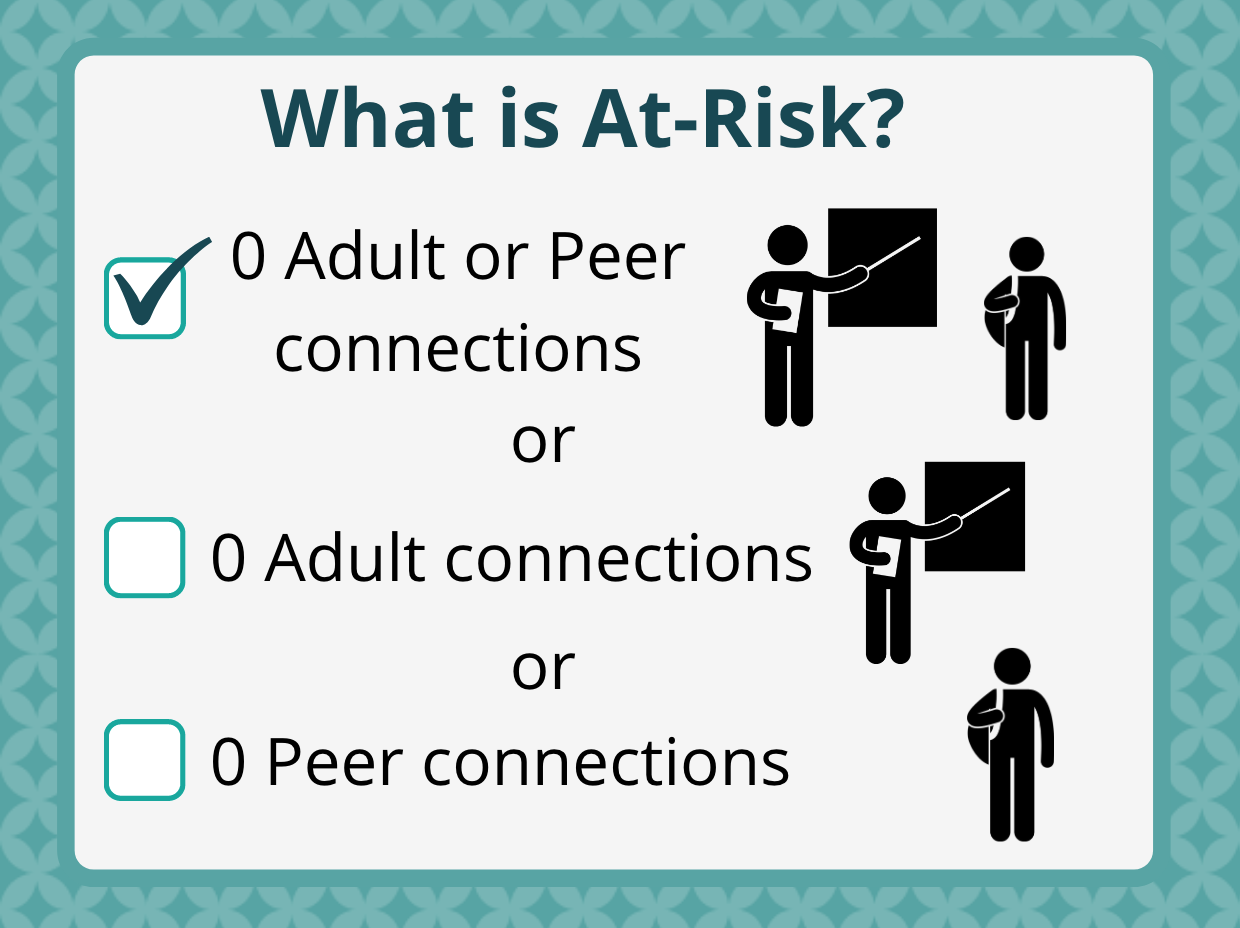
Students who have not identified adult or peer connections are considered most at-risk. Other students considered at-risk are those who have no adult connections (but do have peer connections) or have no peer connections (but do have adult connections). As your team develops follow-up, next steps and interventions, looking at students in these categories can assist with identifying exactly what you will do. Students with similar needs may be grouped together. A real-life example that occurred at BHS was a girls lunch group that was created and supported by the school psychologist for several girls who reported no peer connections. Even after the group support ended, the girls continued to eat together at lunch. Other ideas may be:
- Students with no adult connections may be candidates for the evidence-based intervention Check and Connect.
- Students with no adult connections may be considered for mentorship programs.
- For a student who did not identify any adult connections, but a staff member identified that student, consider ways the staff member can reach out to that student in meaningful ways.
- Students with no peer connections may be considered for newly formed school groups or activities and supported by staff.
- Follow up on Early Warning Indicators for students considered at-risk to determine whether attendance or academics is also a factor to be addressed.
- If you enter demographic about your students you may also use that information to determine level of risk, triangulate data and look deeper at connections among subgroups in your building (e.g., differently abled, multilingual learners, vulnerable populations, etc.)
Brainstorm with your team for other ideas. Schools who were part of past Connections Project cohorts used their data in a variety of ways, including changing how their advisories were assigned (keeping students with the same advisors for more than one year to strengthen relationships) and structuring advisories to include relationship-building activities.
3. The Impact of COVID-19
The 2020-21 school year had unprecedented impact on students and educators due to the impact of COVID-19 on our learning environments. In turn, this had an effect on how educators were able to connect with their students, as well as how we could measure those connections. In this course we will be showing you how the Connections Screener is intended to be implemented and relay information about implementation in pre-COVID setting. We have also learned from administration of the Connections Screener during virtual, in-person and hybrid settings and will share those with you.
As a response to the shift in education due to COVID-19, in February 2021 Commissioner Angélica Infante-Green announced the Learning, Equity & Accelerated Pathways (LEAP) Task Force which convened and engaged in a participatory, evidence-informed, data-driven process to understand impact on Rhode Island student learning in partnership with educational experts, practitioners, families, students and community members across Rhode Island. In April 2021 the Learning, Equity & Accelerated Pathways Task Force Report was published. Of particular note in this report is the focus on student social and emotional well-being and safety embedded throughout the recommendations. In particular:
- A strong focus on relationships for positive site climate.
- Universally screening all students both academically and social-emotionally, and targeting resources based on need and urgency.
- The importance of relationship and ensuring students have a consistent adult in their life and giving students the opportunity to create sustained supportive relationships with adults.
- Prioritizing students’ and staff's health and safety above all else.
This is especially true in low-income communities and for the most at-risk and vulnerable students—students of color, differently-abled students, and multilingual learners—who were already facing disparities that have now been exacerbated. Although these
numbers may be higher in particular locations, vulnerable students exist in all of our schools and districts and we must ensure that we are finding ways to meet their needs.
You have reached the end of this book. Return to the course homepage or review the option resources below. You may also move to the next activity.
Optional Resources
Please select if you are interested in reading the full LEAP Task Force Report:
