History of Connections Screener in RI
2. About the Connections Screener
2.2. Connections data
In this section, there are two different ways we want to talk about data. First is how the data is prepared for analyzing. Watch this screencast as Kim walks you through how the data sheet is prepared.
An important element in using data from your screener is to present it to staff and to measure connectedness from year to year. Here are examples of how data has been used over time in Burrillville High School (BHS).
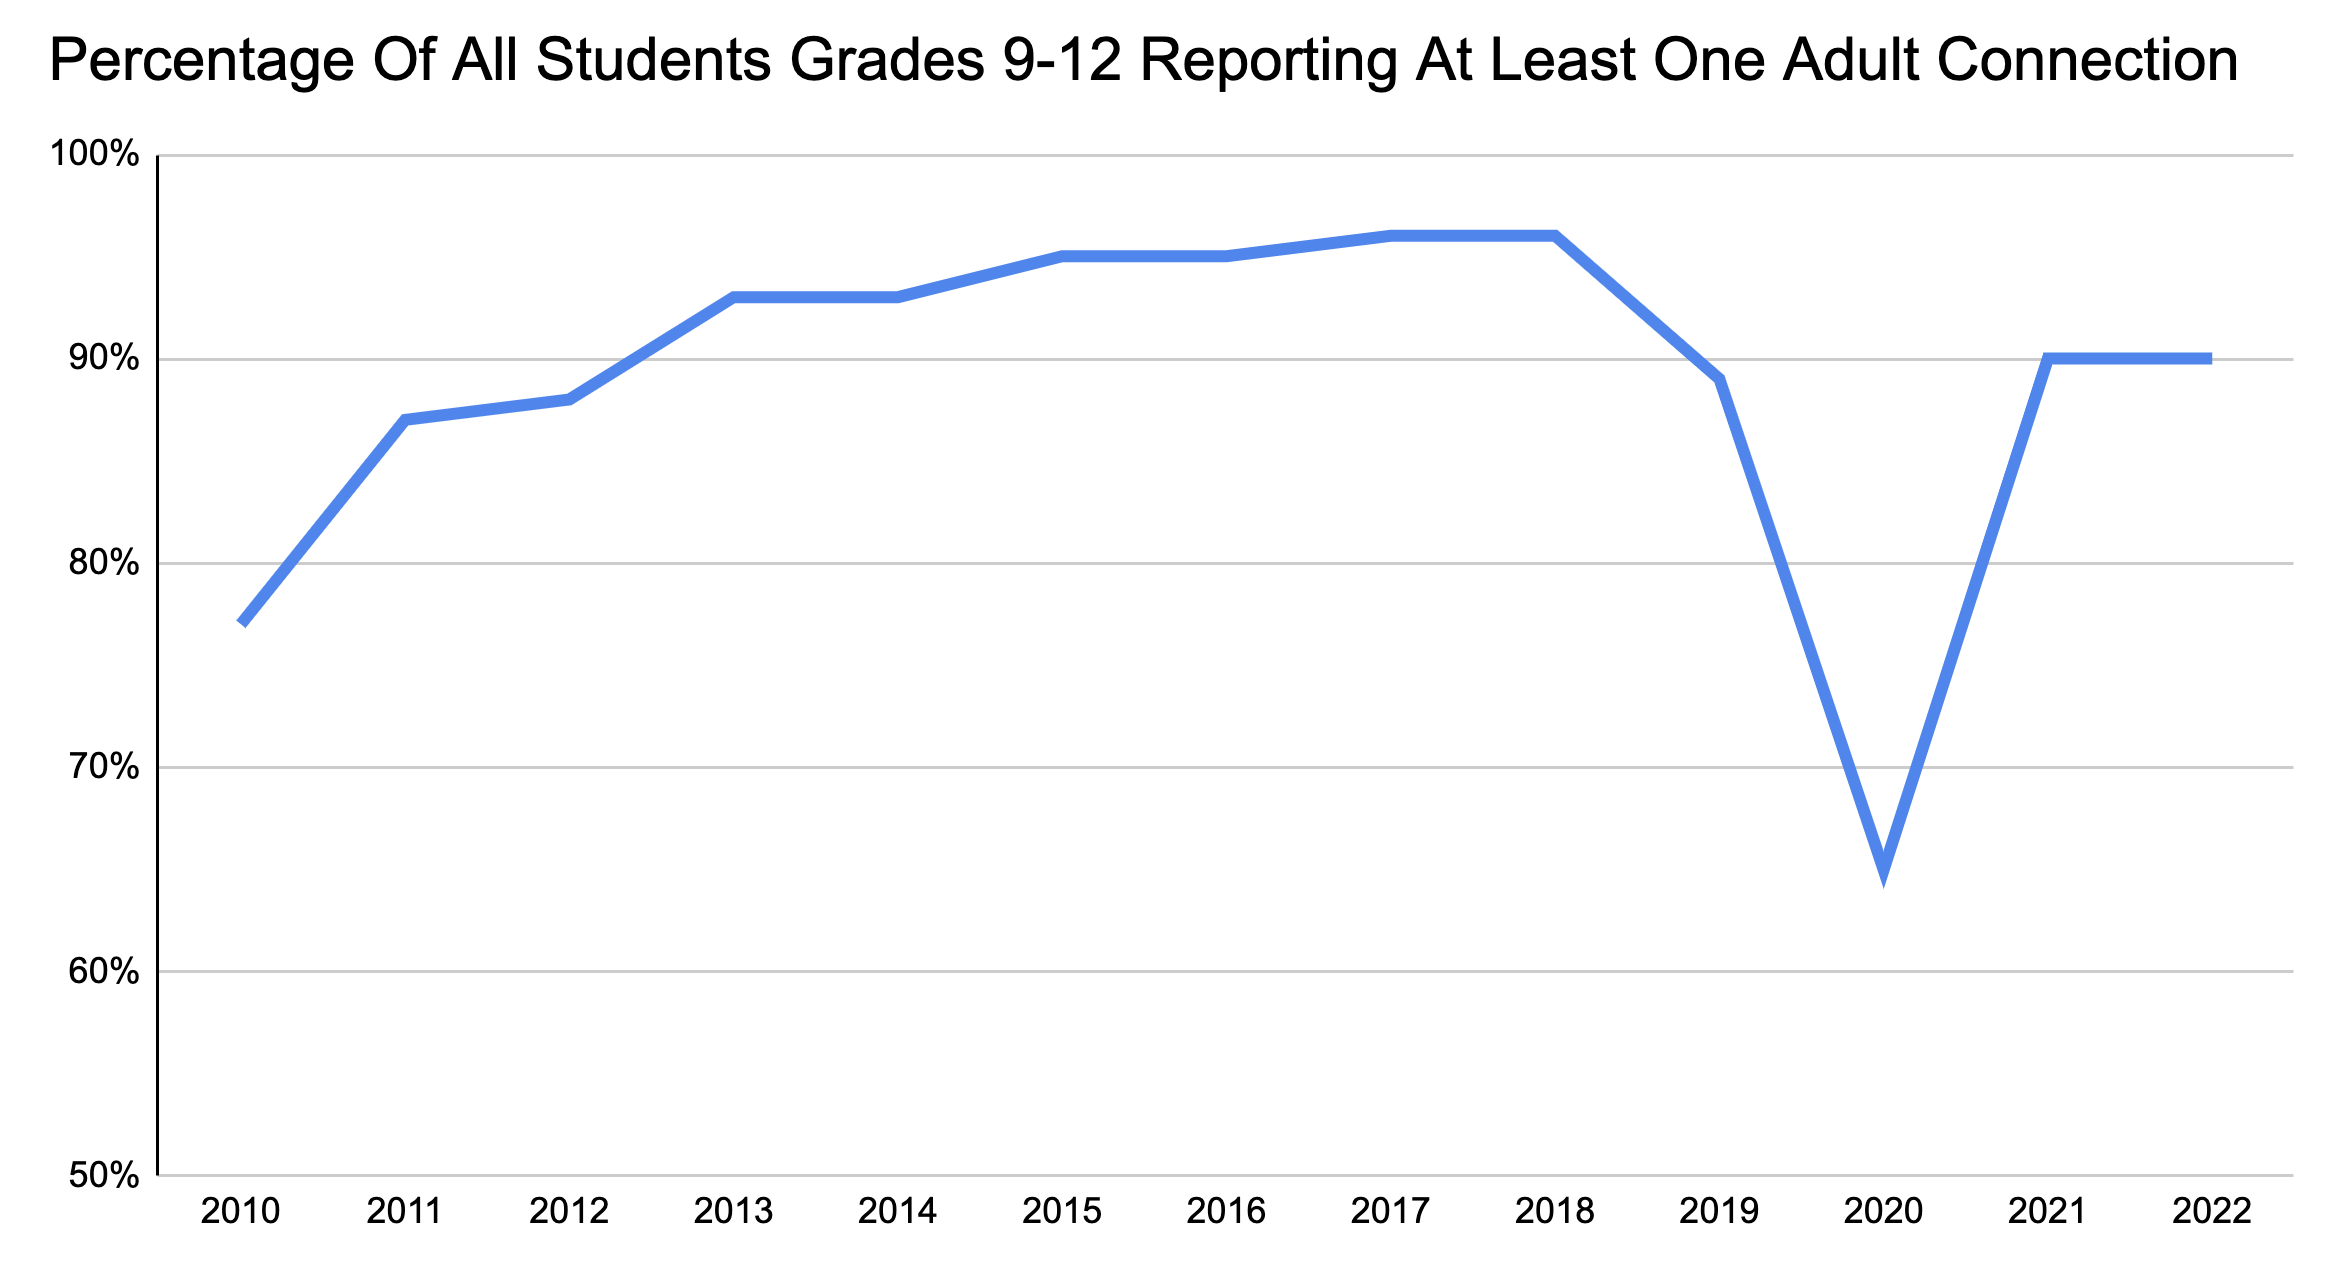
In this graph, the percentage of all students in grades 9-12 reporting at lease one adult connection at BHS from 2010-2022 are shown. In the first year of implementing the screener in 2010, roughly 77% of all students in grades 9-12 reported at least one adult connection. Over the next eight years, the number of students reporting at least one adult connection steadily increased to around 97%. In 2019, the number of connections decreased to 89% and then during the COVID in 2020, that number decreased notably to around 65% of students indicating at least one adult connection. In 2021 and 2022, the number increased to 90% for both years. By tracking the data from year to year, it's easy to see trends over time. If staff had discontinued administering the survey after the first couple of years, and responding to the data once it was collected, do you think the data would have continued to trend upwards? What about after the pandemic?

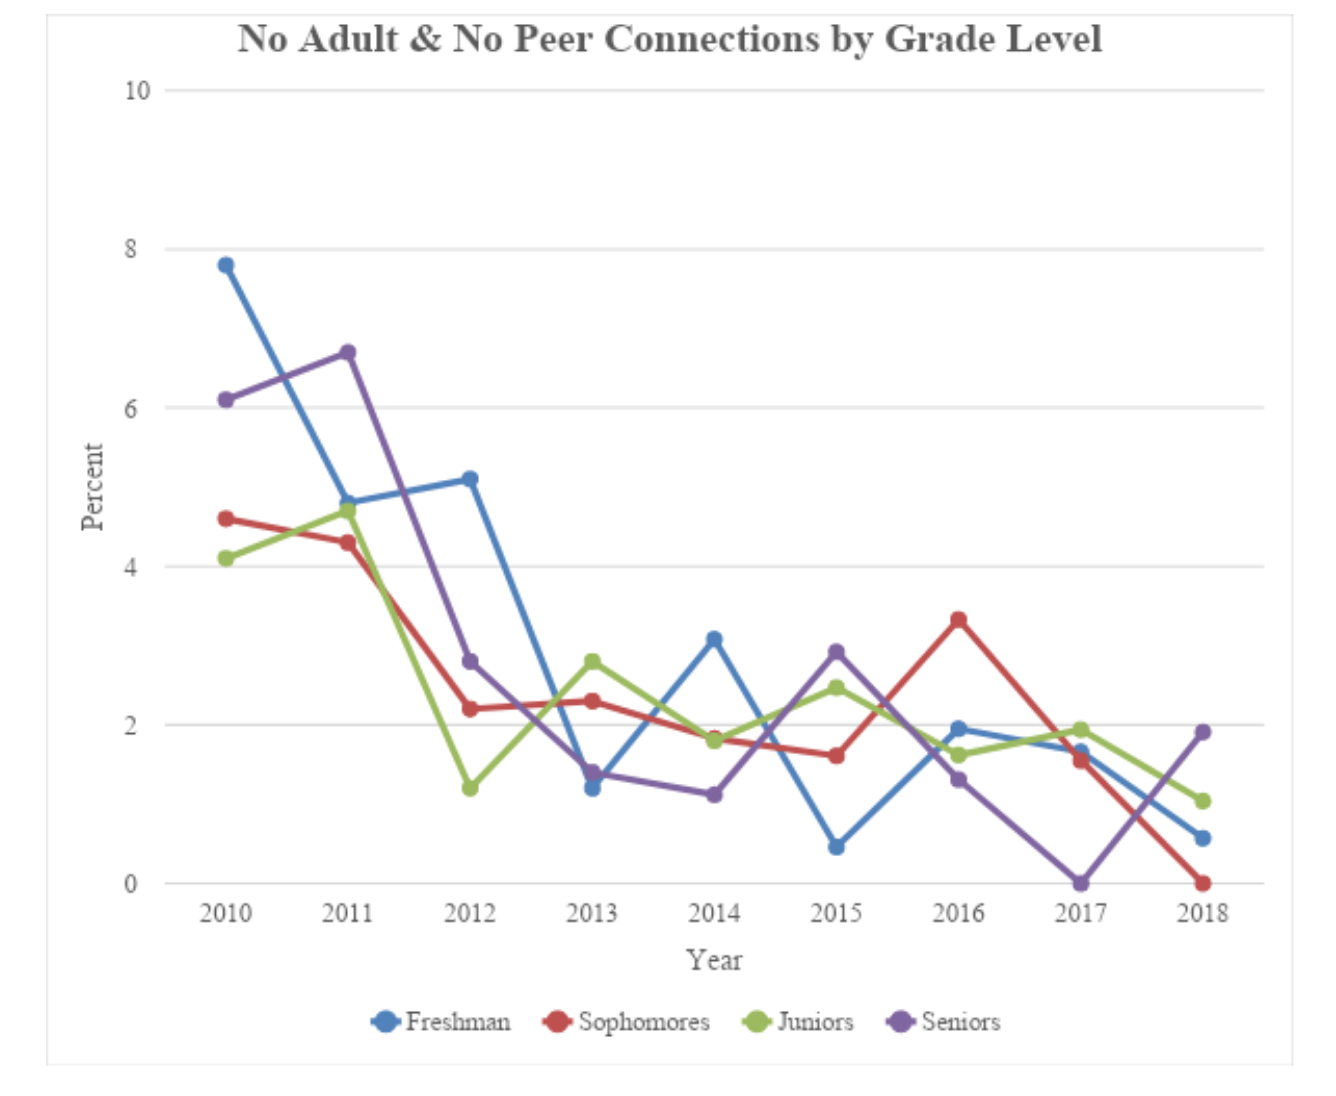
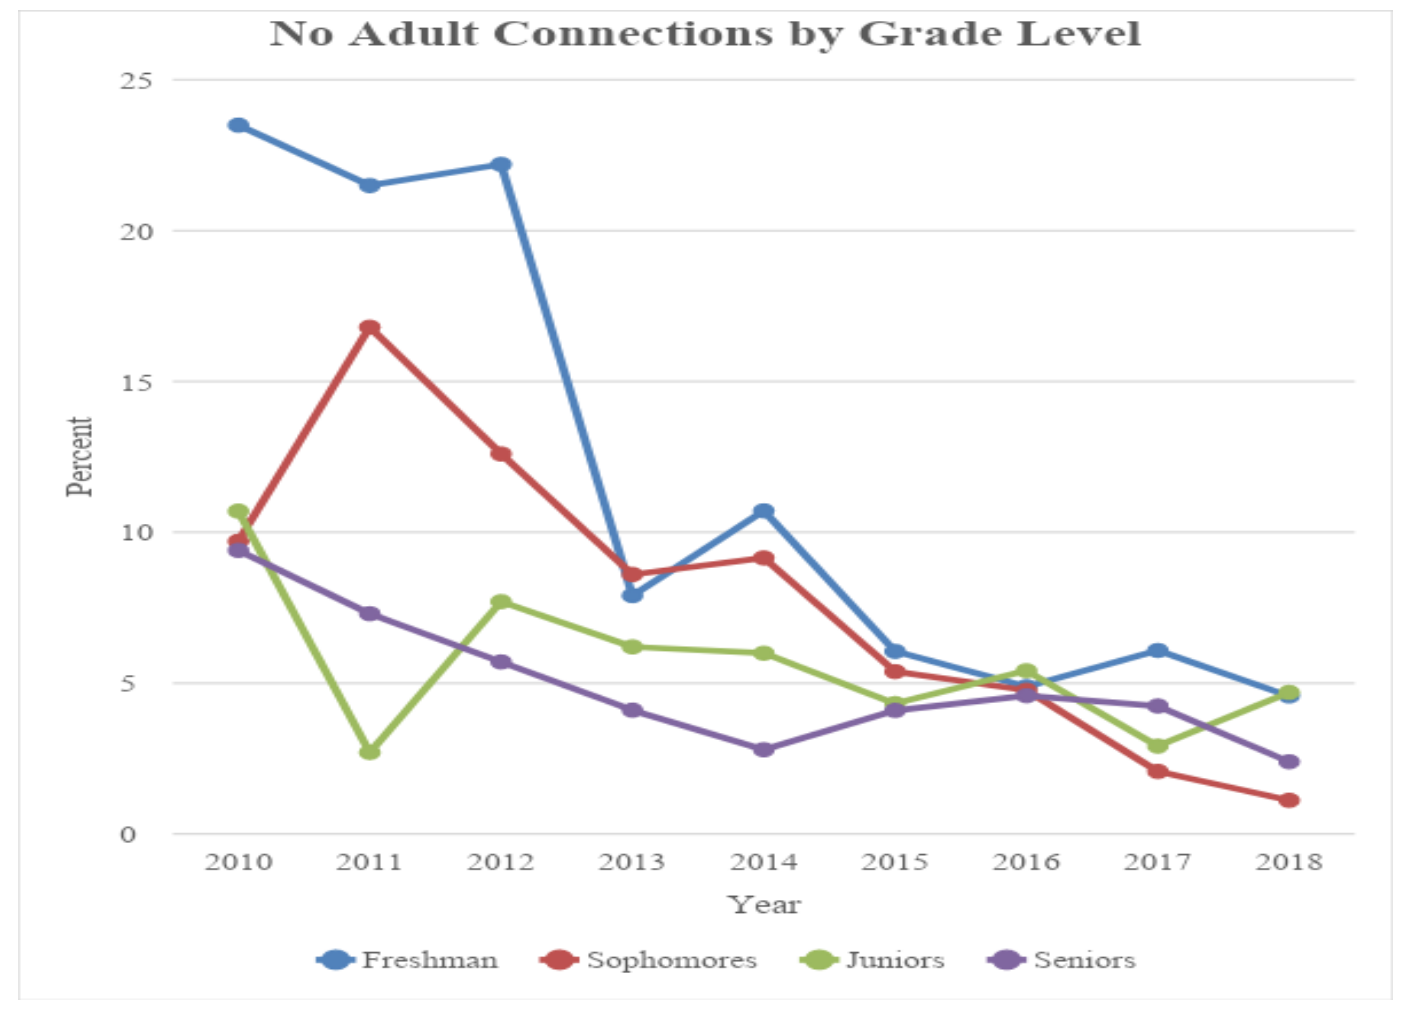
In our past Connections Project cohorts, we had the benefit of partnering with school psychology graduate students from the University of Rhode Island in order to run statistical analysis on data from our cohorts. Select below to see the data collected during that partnership.

